

Peanuts Crop Evolution Report January 2019
General Overview
We started the new year with a peanut crop that, so far, is looking good and promising. Heavy rains and high temperatures were fairly distributed throughout the peanut areas during January, which created very good conditions for crop development. As we enter February, a new key stage appears in the horizon since peanuts will have very high demands of water and nutrients in order to achieve their maximum potential. With a good deal of caution, considering that there still are several weeks to go, the Argentine peanut cluster is looking at the new crop with optimism.

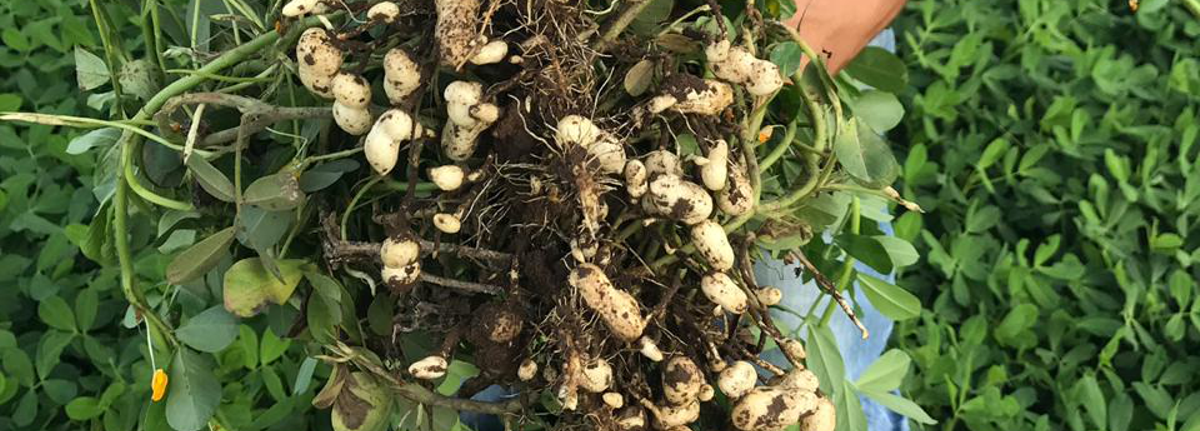
Image 1: Peanuts in the Central Area.
Main Peanut Area Map
The main peanut area in Argentina includes the provinces of Cordoba, La Pampa, San Luis and Buenos Aires. In general terms, it can be divided as follows:

Image 2: Main peanut area map.
Agricultural and climatic condition
In line with data gathered from onsite inspections in different areas, peanut fields are presently deemed to be going through advanced vegetative and reproductive stages. Additionally, soil profiles are in field condition in all productive areas. In order to summarize the climatic conditions that prevailed in the course of January, we may report extreme rainfall records in several locations in the provinces of Cordoba and Buenos Aires, since accumulated records exceeded 150 mm in 24 hours. Such mark in short time-periods generated bleak scenarios for farmers and dwellers from different productive areas, since floods affected rural communities as well as adjacent fields. According to our reference map for planted areas, the east of the province featured heavier rainfall than other areas. Bell Ville and Canals were among the locations that suffered the most severe consequences. As of the date of this report, the agronomic scenario is complex, since lots failed to drain, and this is vital to carry out weed control and timely fungicide applications. It is still early to quantify the degree of damage.

Image 3: Peanuts in the Central-Southern Area.

Image 4: Peanuts in the Central-Southern Area.
Rain distribution in Peanut-Growing Areas
January rain in the Central, Central-Southern, Western and Southern areas increased soil moisture profiles even more, which is positive since environmental and crop demands are high. Such profiles are required to achieve yields above average levels. The soil profiles in the Northern area featured seasonal drought and received heavy rainfall. This facilitated higher infiltration rates after the rain in recent weeks. Finally, January is ending with considerable rainfall across all peanut-growing areas. If we consider the former in line with December rain, we may conclude that 2018 was a good year in climatic terms, since peanuts shall go through a significant period of their critical stage (beginning peg and beginning pod) with soil profiles in field condition.

Image 5: Accumulated monthly precipitations – January 2019.
Available water content in Cordoba
Soil moisture may reach its maximum retention capacity or field capacity (by which plants extract water without difficulty). Between field capacity and the permanent wilting point stands the range that we designate Useful Water in the Arable Layer. The chart depicts values ranging between 80% and 90% of useful water in the soil profile towards mid-January in the peanut-growing area (Field condition). Values are higher in the northeast of the Buenos Aires province. Source: FAUBA.

Image 6: Images comparing the available water content percentage on the same day and month of 2018 and 2019.
Phenological development stages
Peanuts are in the early reproductive stages, R3 – R4 (beginning pod and full pod). Water requirements at such stages are higher than in prior stages. Consequently, weather conditions such as high sun exposure and regular precipitation are vital in defining what is presently considered a good prospective harvest.

Image 7: Phenological crop condition as of January 29th.
Peanut Development Stages
V1: first tetrafoliolate leaf V2: second tetrafoliolate leaf V3: third tetrafoliolate leaf V4: fourth tetrafoliolate leaf V – (N): one to N developed nodes on main axis R1: beginning bloom R2: beginning peg R3: beginning pod R4: full pod R5: beginning seed R6: full seed R7: beginning maturity R8: harvest maturity 
Image 8: Peanuts in the Southern Area.
Crop-related Tasks
Herbicide treatments were continued in order to control weeds across all the areas on our reference map. Weeding hoe tasks were intensified in peanut lots to control resistant weeds. Farmers are planning the second fungicide application in order to prevent leaf diseases (peanut leaf spot). High temperature and humidity promote the development of this soil disease as well as others, like S. sclerotiorum. The latter is highly dangerous, since it is resistant to available chemicals and causes plant death. Ongoing monitoring is vital to define early digging, when applicable. It is worth mentioning that S. sclerotiorum requires lower temperatures to prosper, mainly at nighttime, and for the time being, this has not occurred.

Image 9: Peanuts in the Southern Area.
Agricultural Issues
Presently, the most pressing problem to address is resistant weeds. For example, Eleusine, Sorghum halepense and Chloris pose a serious management threat due to their high reproduction capacity, high growth rate and lack of active ingredients to achieve their chemical control. On the other hand, we observed leaf scorch disease (Leptosphaerulina Crassiasca) in some fields of the Central and Central-Southern areas, although this disease is not normally a threat for the crop. No problems have appeared in the management of leaf disease, but special attention is required in fungicide rotation, in order to avoid resistance. Timely applications are required in line with the current climatic conditions, which favor peanut leaf spot development.
Image 10: Peanuts in the Eastern Area.
Extended Forecast Trends
The following image depicts a model of the probabilities of occurrence for every event according to ENSO. January ended with high rainfall probability, followed by February and March, which feature the same probabilities according to the model; that is to say, more than 80% probability of occurrence. The probability for La Niña is low or null, and becomes evident starting in May. As from March and April (gray line), a Neutral year is foreseeable, El Niño prevailing over La Niña phenomenon. According to the chart, the climatic probability (lines) is that the long-term trend presents a neutral year starting in May, but heavily affected by El Niño, which implies higher rainfall in the peanut-growing area, which would be counterproductive in achieving optimal results in peanut digging and harvesting activities.
 Image 11: ENSO probability chart. Source: Institute for Climate and Society – Columbia University
Cordoba Grain Exchange (BCCBA) Report
A fragment of the BCCBA report, which was recently released, is shared below. The planted area is expected to reach 324,500 ha in the peanut-growing area extending across Cordoba, San Luis, La Pampa and the northwest of Buenos Aires. This accounts for 17.7% less than the previous season. Out of this total, 284,100 ha have been allocated to peanut crops in Cordoba. Planted peanut areas suffered a reduction in the province (-17%) as well as the peanut-growing area extending across Cordoba, San Luis, La Pampa and Buenos Aires (-17.7%). Out of the 324,500 ha to be planted, 20,000 ha have been cancelled, and Cordoba would be the province to cancel the largest extension. Should this trend continue, 2018/19 would feature the smallest planted area in the last ten years, mainly due to poor overall yields in the previous season, featuring yields that barely exceeded 22 qq/ha.

Image12: Evolution of the peanut planted area in the last 4 seasons.

Image 13: Planted area percentage variation by department (Cordoba province) compared to Crop 2017/18.
 Image 14 – Left: Phenological crop condition in the entire peanut area – Crop 2018/19 – January.
Image 14 – Right: General peanut condition in the entire peanut area – Crop 2018/19 – January.
Final Remarks
In the last few weeks, peanuts featured significant growth and evolution, since climatic conditions have been practically the ideal ones for crop development. Available water content is above 80%, the ideal condition for peanut development and growth. Peanuts continue evolving favorably; high sun exposure and soil moisture reversed the delay in several areas, as stated in previous reports. Peanuts are in the early development stages, R3 – R4 (beginning pod and full pod), featuring higher water requirements. The prevailing climatic conditions increase the likelihood of fungal diseases. Therefore, monitoring and timeliness of applications is vital. Although soil disease foci have been detected, (S. sclerotiorum), attacks are mild, but their early appearance flashes a yellow light on the dashboard. There is still a long way ahead. February is considered a key month, since peanuts will face their highest environmental and nutritional demand for the full pod stage. To conclude, the crop features good potential at present, better than last year at this same time.

Image 15: Peanuts in the Northern Area.
Do you have a commercial inquiry?
Request for price quote?
Other questions or comments?
Contact us stembras@gastaldihnos.com.ar
